Focus your marketing efforts with Google Analytics
Learn how to use use Google Analytics with Appcues to identify trends in user interaction with in-product messaging.
Table of Contents
Appcues + Google Analytics
Google Analytics is an analytics platform that allows you to visualizes acquisition channels. This information allows you to identify trends in user interaction with in-product messaging.
By connecting Google Analytics and Appcues, you can see the big picture:
- how users find your product
- how they interact with in-product content
- what features bring them the most value
Note: This build guide assumes that the integration between Appcues and Google Analytics has been setup. If you need support, this guide will help you get the data flowing!
What data is used? What metrics are impacted?
- Appcues<>Google Analytics is a one-way integration and updates in real time.
- Appcues data ➡ Google Analytics: Understand acquisition, user engagement with your flows, key user actions, and which pages/screens get the most traffic for targeting. Events sent include flow events, step events, form events, NPS events, checklist events, pin events, and custom events.
How can Google Analytics help focus your marketing efforts?
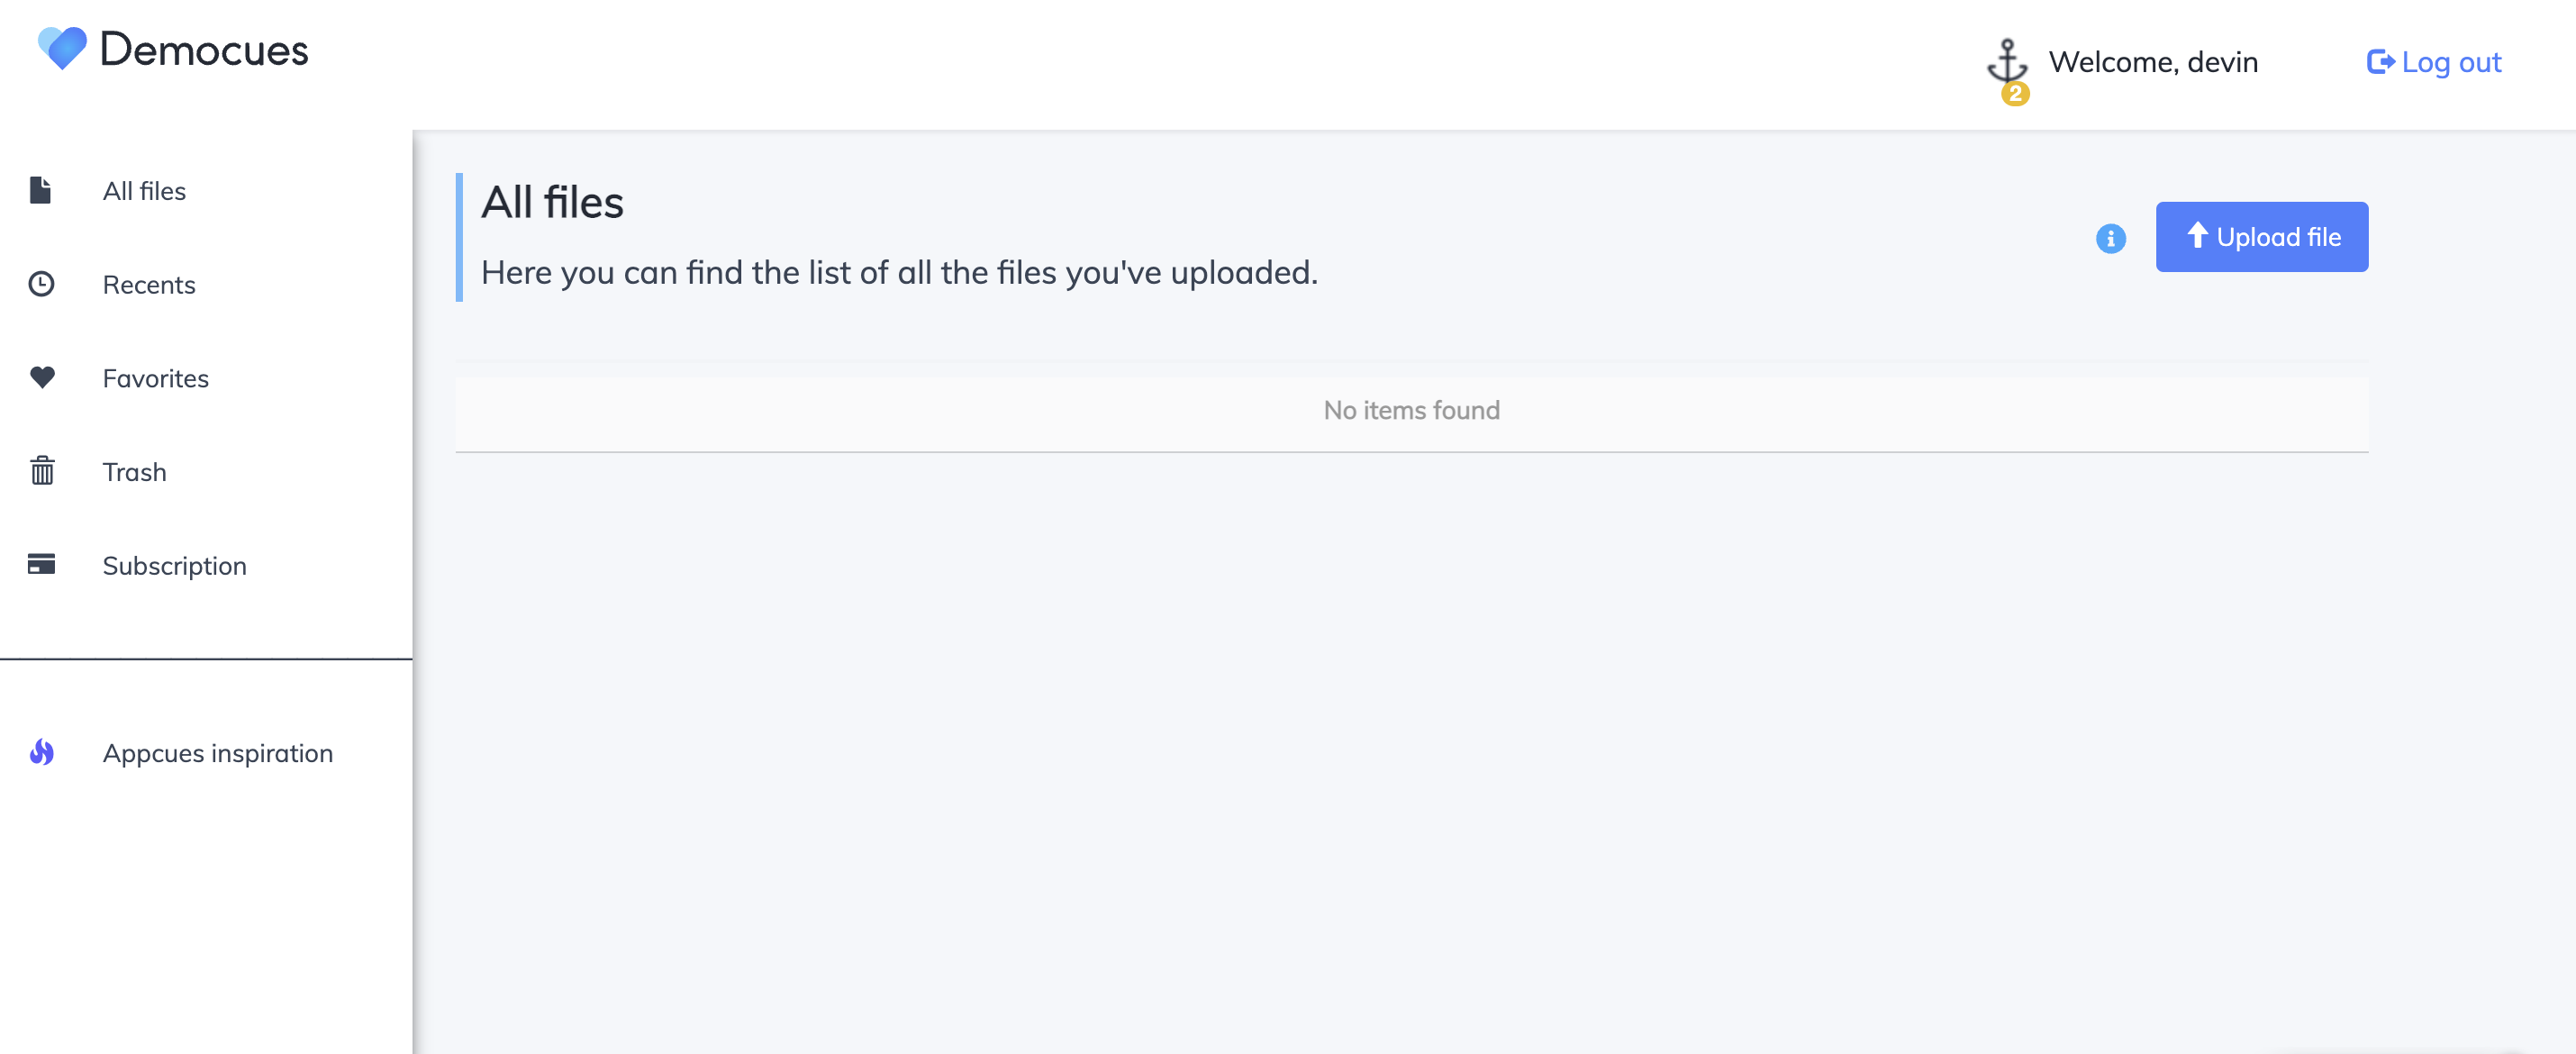
In this example, we'll use a file storage product called Democues. Our goal is to create an in-product onboarding journey. This product offers users a place to store and share files with others.
Let's look at acquisition and event data to understand the following:
- How users find the product- organic search? or a direct CTA?
- Session data, to compare our findings
- Where most users are located
- # of users performing our key event (user action)
- How can we get users to return and pay for our product?
1. View acquisition data
To view acquisition data, select Reports in the left-hand menu. Select life cycle, Acquisition, then Traffic Acquisition.
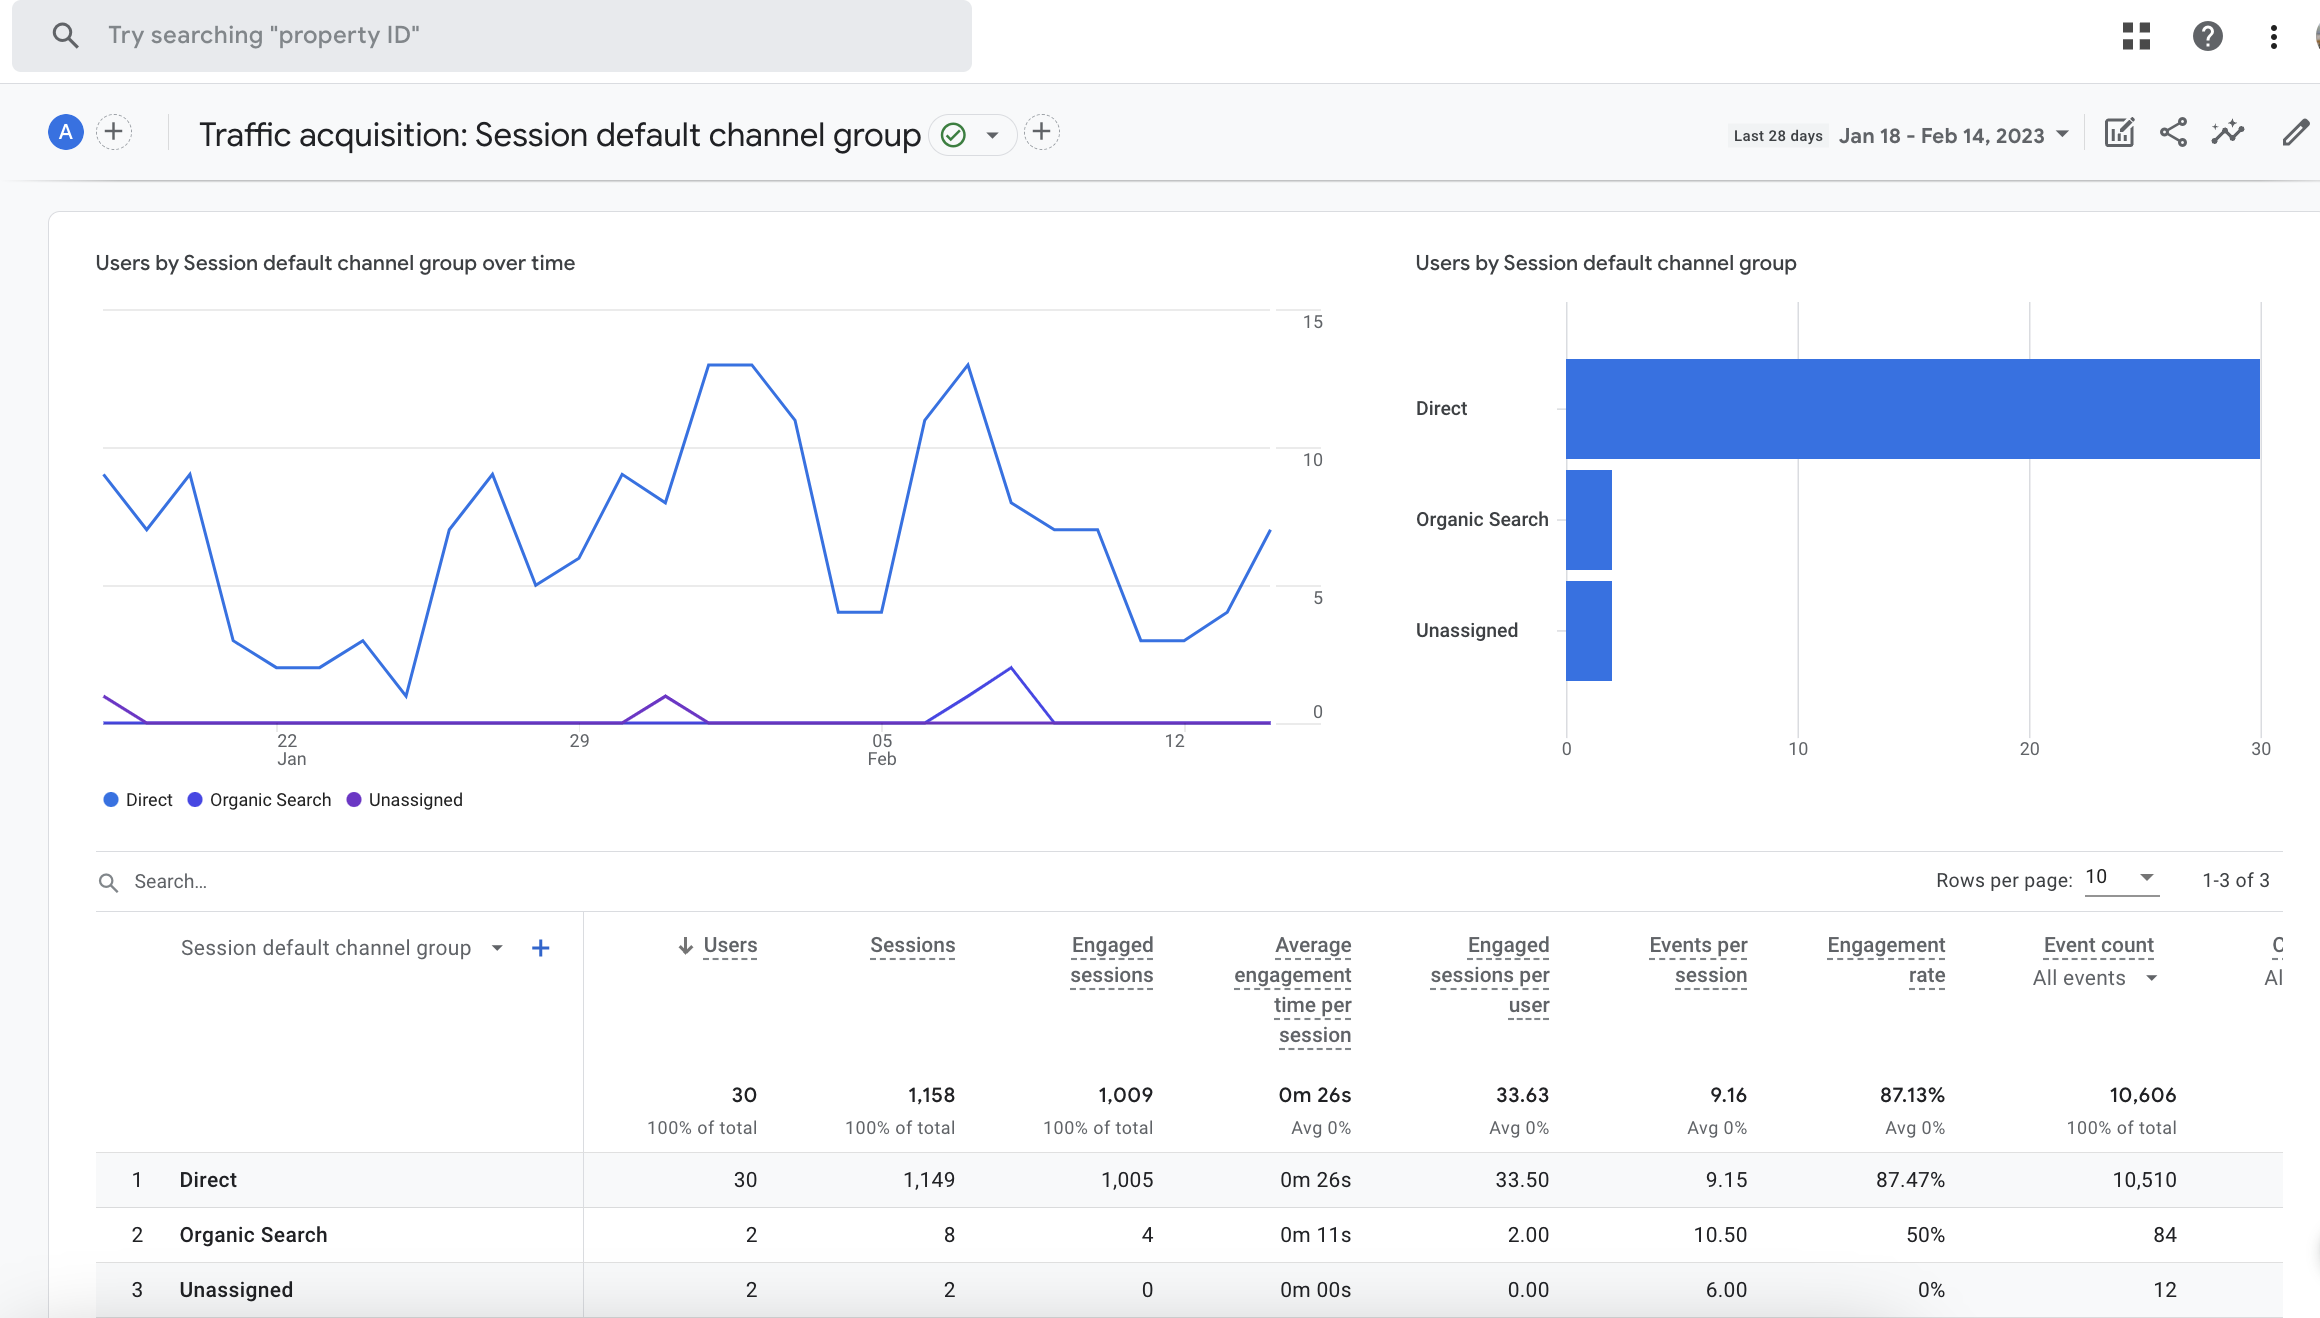
Here, we can see that most of our users arrive to the product directly, not through an organic search. A CTA from marketing or sales likely provided the user with some context before they arrived. We'll keep basic knowledge of our product in mind when we build our Appcues content.
2. Create an Event Report
Find trends in user behavior with an event report. To create a report, locate the Engagement dropdown, then select Events. To add the events you'd like to compare, select Add Comparison and create your conditions.
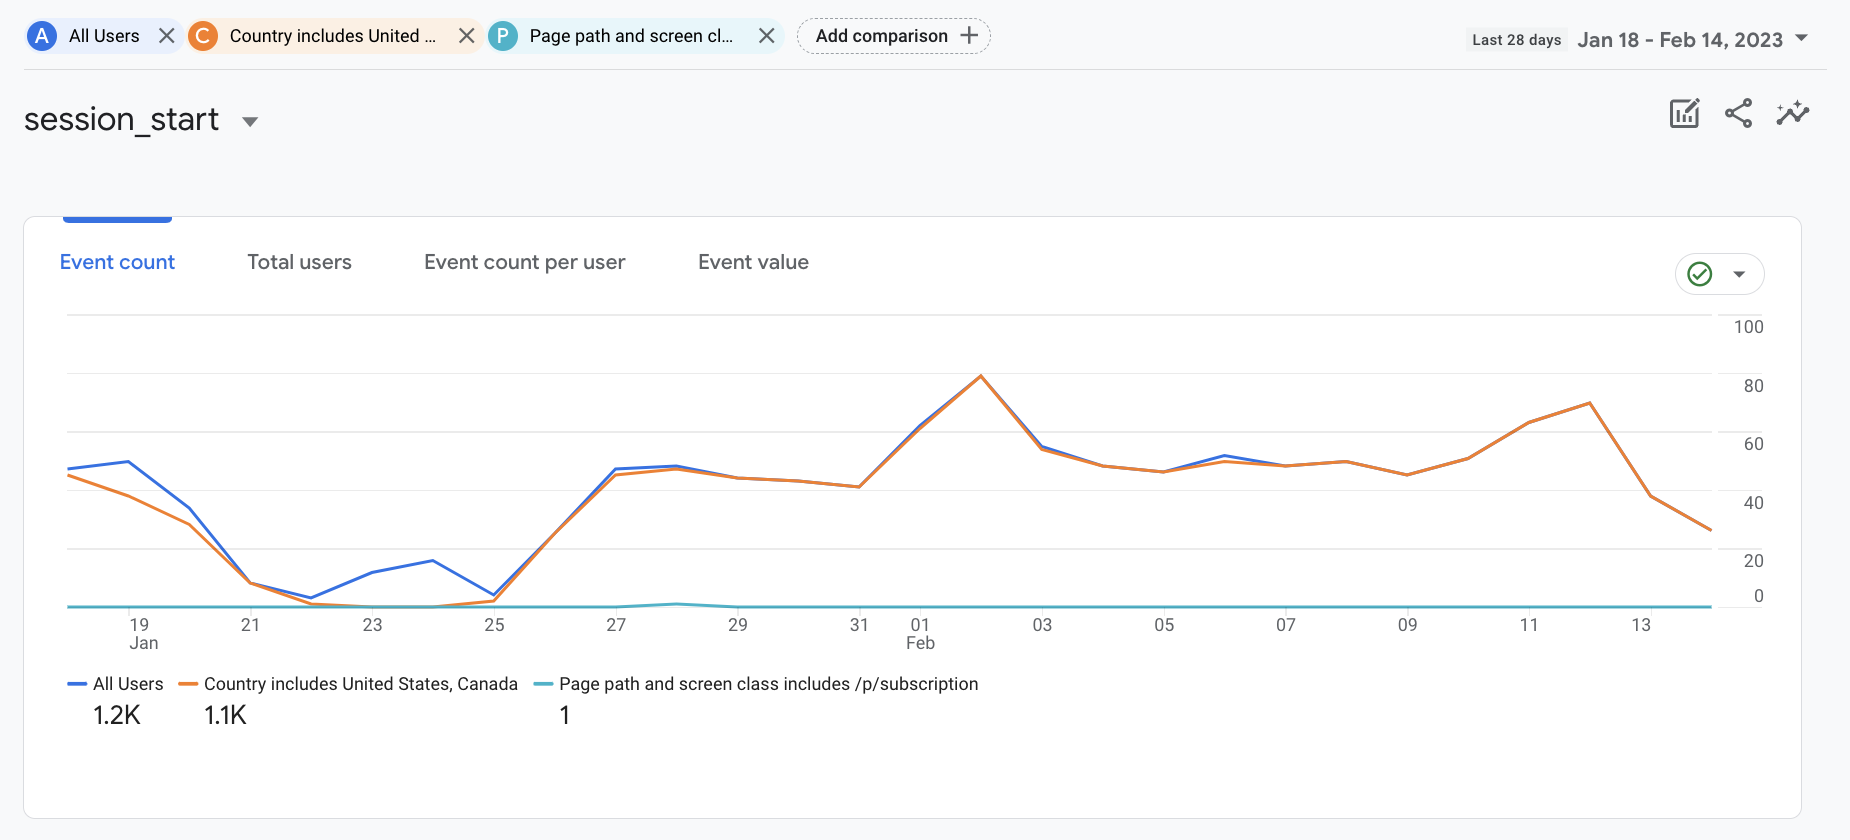
This report includes: session start data, users located in the United States and Canada, and the frequency the subscription page is viewed. Our results show:
- of the 1,200 users who have started a session this past month, 1,100 are from the United States and Canada
- 1 user who navigated to the subscription page of our product, where users pay for added storage
- The key user action, Uploading a File, has only been taken 150 times by 12 users. Our onboarding will take all of this into account since we want users to convert and purchase more storage
3. Create your Appcues content!
With the data of users who upload files (the key event to finding value in our product), visits to the subscription page, and knowing where users are based, we've identified our goals. The flow below will support feature adoption and customer retention!
Onboarding Focus
- The welcome modal is clear and concise. We've offered personal vs. business options to learn more about our customers.
- Hotspots point out subscription information subtly. As we monitor impact, we may switch to tooltips to grab the user's attention a bit more.
- Onboarding is short and sweet! It drives users to upload files, our key user action.