Control Experiments in Appcues
Learn how to run a control experiment and measure the impact of your Flows.
Table of Contents
What are control experiments?
A control experiment measures the difference in downstream behavior between two groups: an exposed group that was prompted beforehand to take a certain action, and a control group that was not prompted and instead left to discover the action on their own. Aside from the difference in prompting, the two groups should otherwise be identical in terms of audience composition.
Why should I run a control experiment?
The best Appcues Flows are those that drive your users to take a specific action in your app. For example, the purpose of your Flow may be to get users to complete the signup process, enter their credit card information, or try out a new feature. Appcues makes it easy to track this behavior conversion using Goals.
However, just knowing your Flow's Goal conversion rate only takes you so far. Is a 15% conversion rate good or bad? Compared to what? A control experiment is a great way to better measure the incremental impact that your Flow is having to drive users to take an action. In the above case, if a control group (consisting of a similar audience as the exposed group but who were intentionally not shown the Flow) only had a conversion rate of 10%, that's a great sign that your Flow is having a positive impact on your user behavior.
How do control experiments work in Appcues?
A control experiment in Appcues has three main attributes:
- An associated Flow that we will build a control group against.
- A control group size. By default, the control group size is set at 50%, meaning Appcues will randomly choose 50% of eligible users (who would normally have been shown the Flow due to audience targeting) and intentionally block them from seeing the Flow, as a way to measure conversion lift. Initially and throughout the lifetime of the experiment, you can use the Traffic Allocation slider to adjust the percentage of new eligible users you would like to be placed in the control group.
- A Goal that is inherited from the associated Flow. The difference in goal conversion % between the exposed and control groups will be used to determine if your Flow is having a positive or negative impact in driving users to take a specific action.
While an experiment is running on a Flow, Appcues will randomly select a certain percentage of users (matching the control group size set with the Traffic Allocation slider) who would have normally been eligible to see the Flow. Right before they are shown the Flow, they are instead placed into the control group and not shown the Flow. Until the experiment is ended, these users will not be eligible to see the Flow. Users who are allowed to continue to see the Flow are placed in the exposed group.
Creating a control experiment
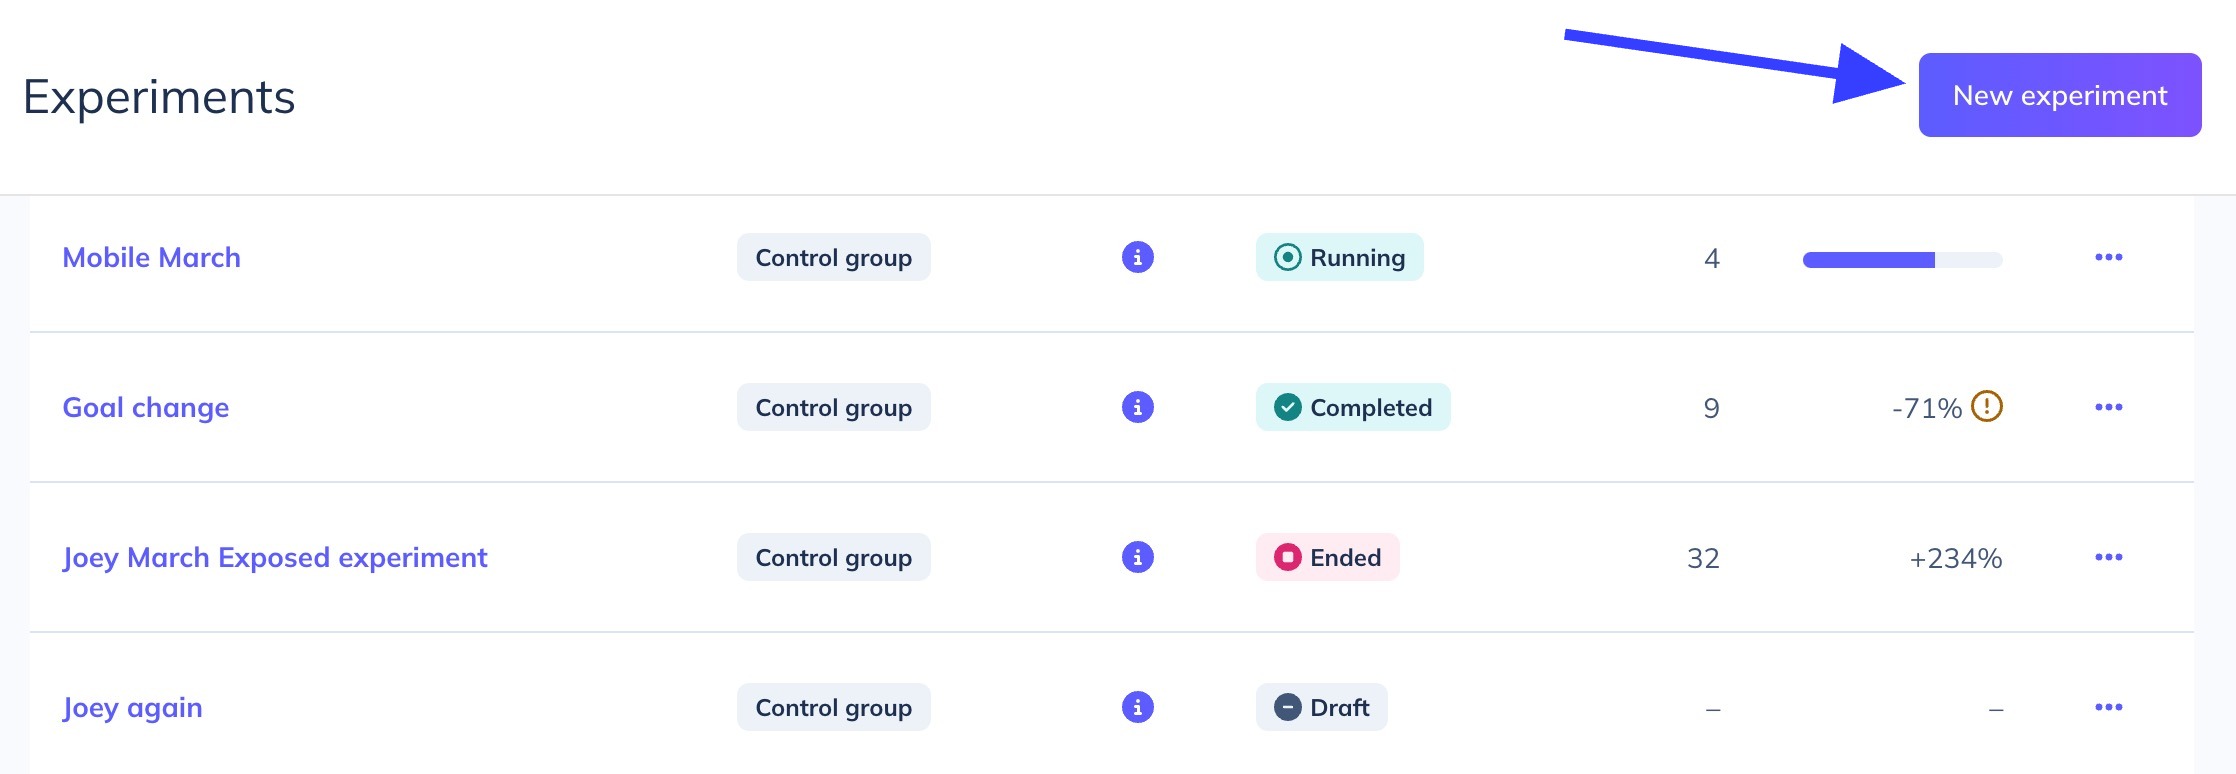
- Click on the Experiments tab on the Flows page. You can navigate there via the Messaging > Flows menu on the left navigation panel.

- Click the New experiment button
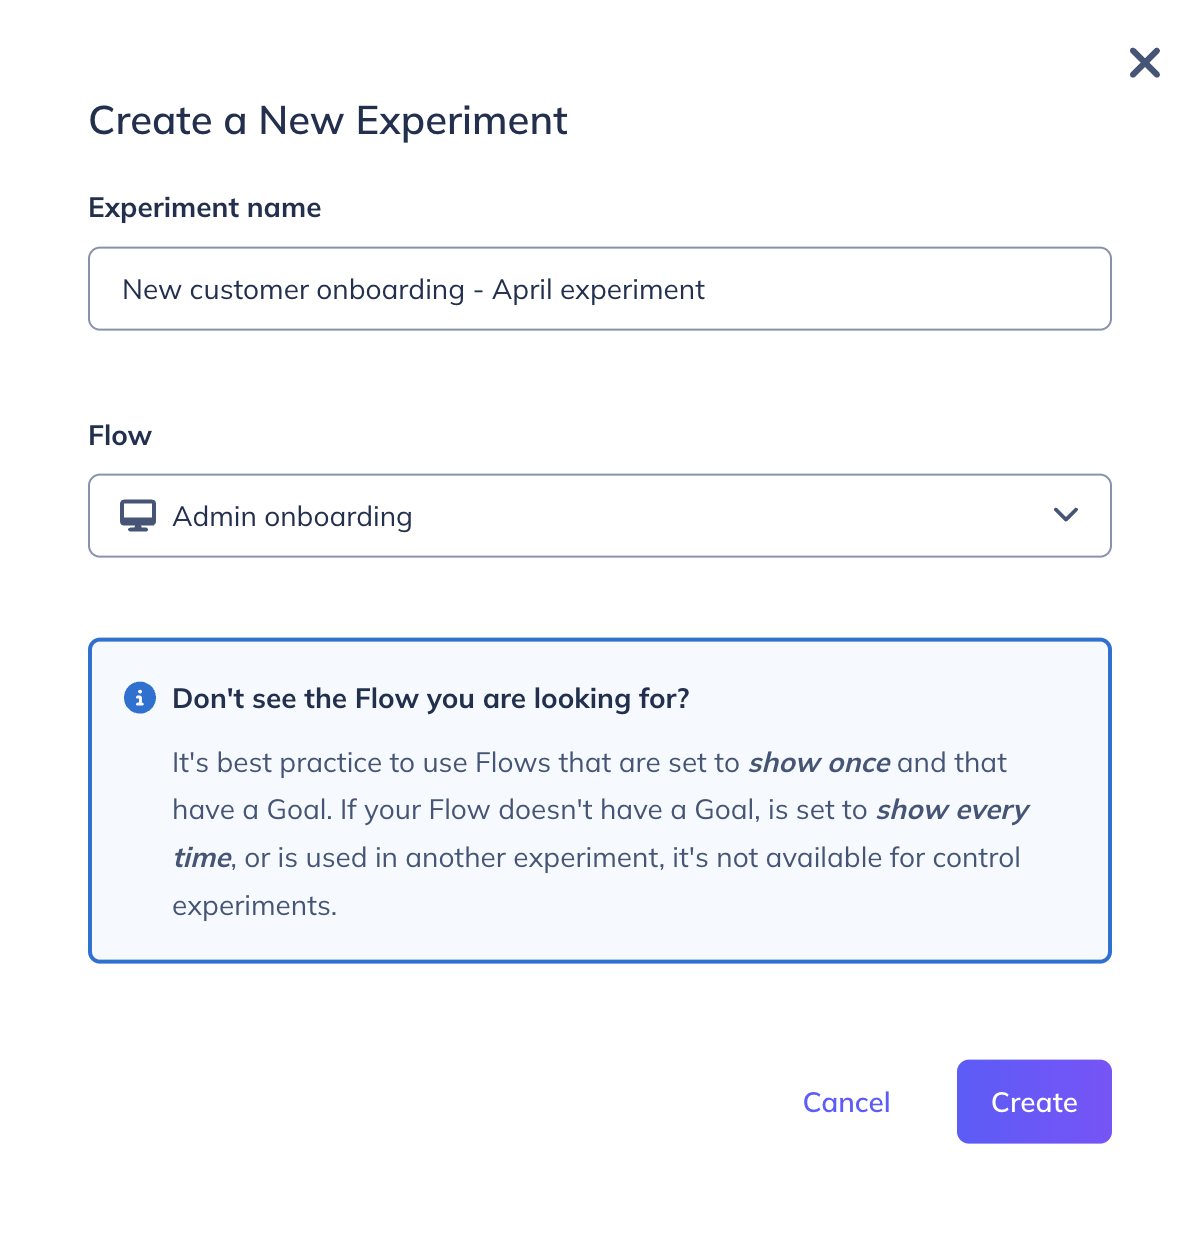
- Give the new experiment an Experiment name and select an existing Flow to run an experiment on
Note: A Flow can only have one active experiment running on it at a time. Flows with an existing experiment in DRAFT, RUNNING, or PAUSED statuses will not appear in this list. In this case, you will have to set the previous experiment to ENDED status for its Flow to reappear in the list.
- Click Create
Launching a control experiment
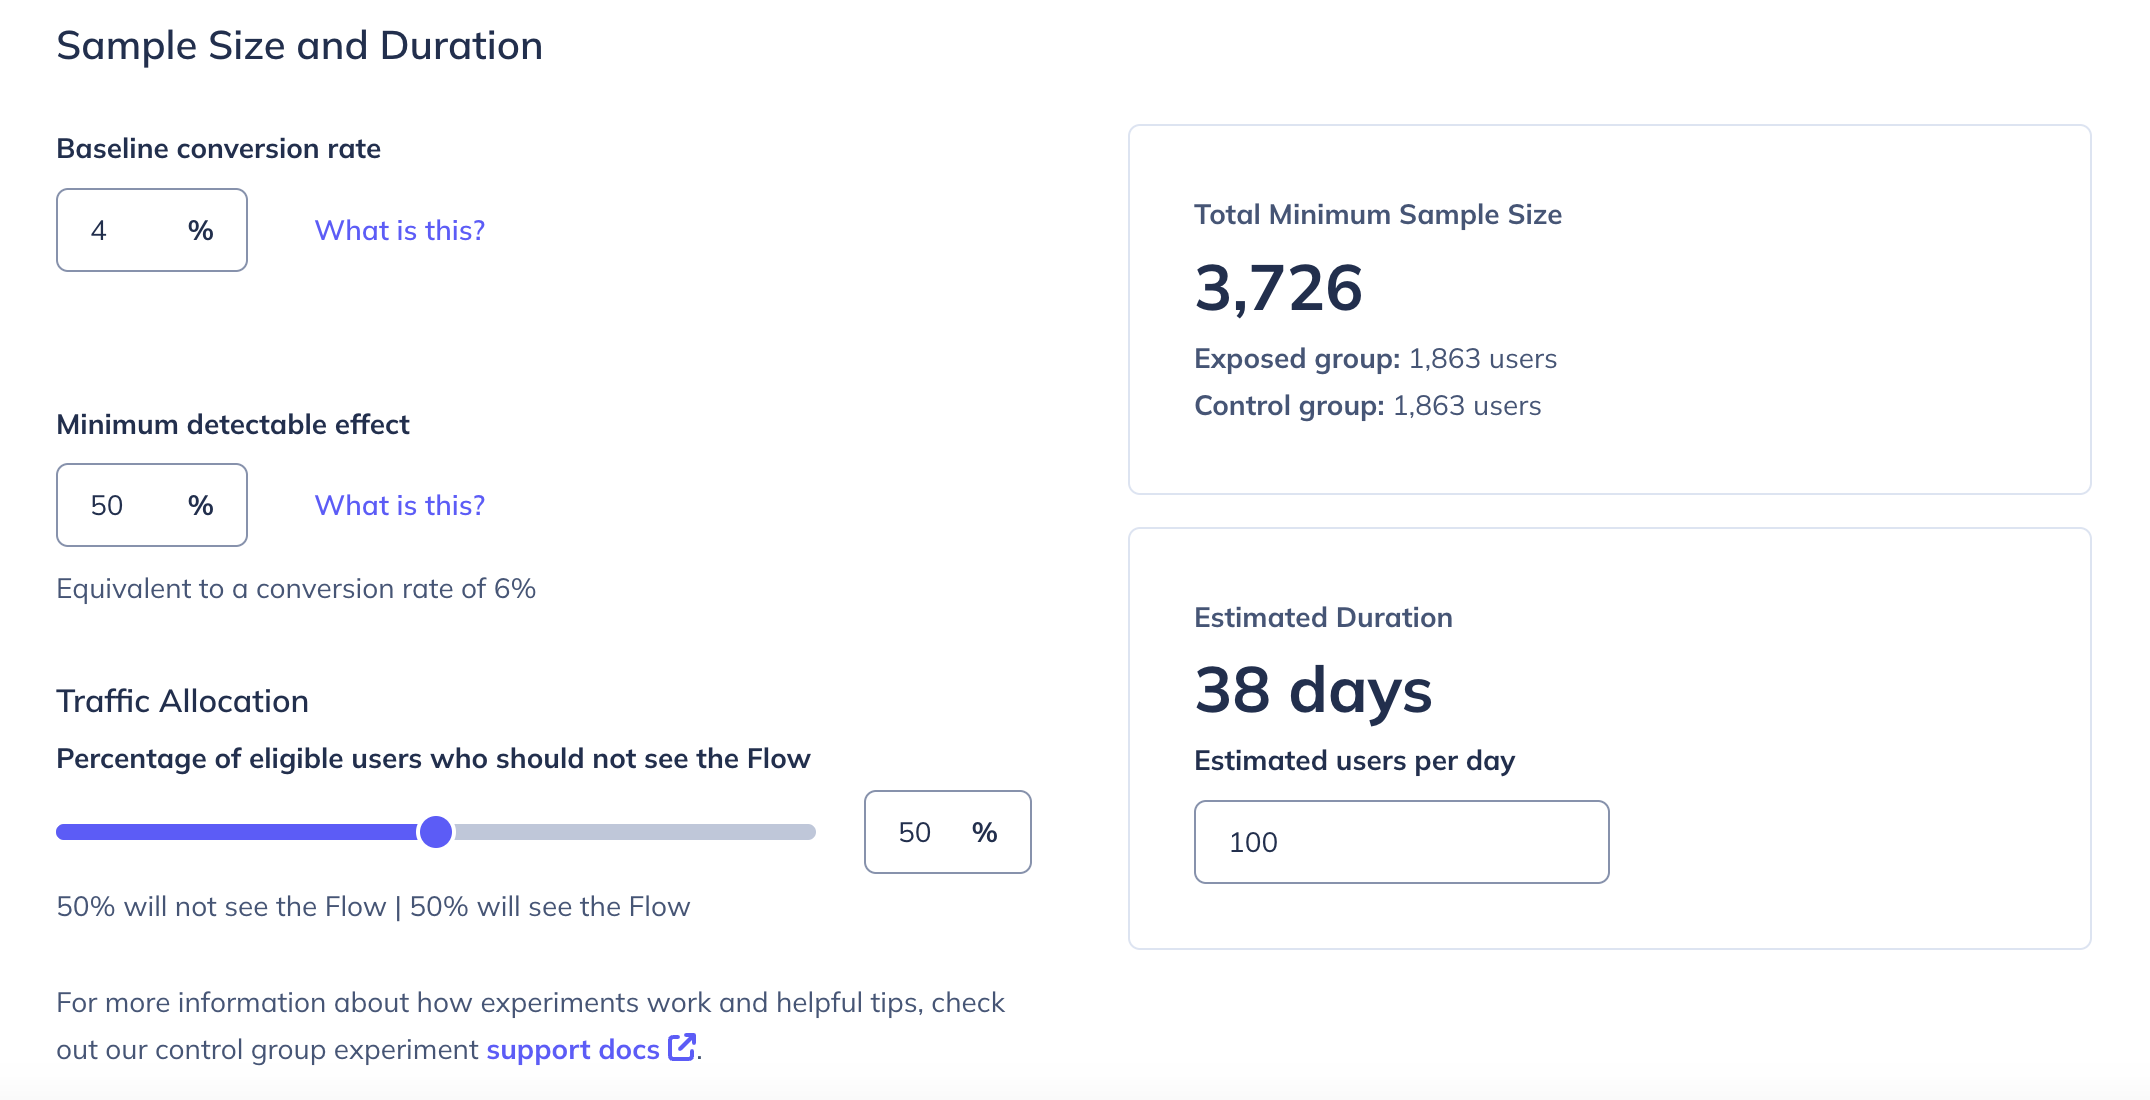
After creating the experiment, you'll be sent to its settings page. Here, you will be asked to enter some estimates to help calculate a Minimum Sample Size and Estimated Duration needed for the experiment before statistical significance can be calculated.
Why do we ask for this information? While we will provide you with a measure of statistical significance for your experiment's results, focusing too early on statistical significance can be a mistake and lead to incorrect conclusions! Early on in an experiment while the sample size is too low, an experiment can easily cross back and forth over the statistical significance threshold several times. Stopping the experiment as soon as you see statistical significance for the first time is a common mistake. Instead, you can calculate a likely minimum sample size needed before statistical significance should be tested. Check out this post for more information about our approach.
When you are ready, click Start in the upper-right corner of the settings page. Your experiment will then be set to RUNNING.
Pausing and resuming a control experiment
Whenever an experiment is RUNNING, you can set its status to PAUSED in the upper-right corner of the settings page. You may want to pause the experiment and exposed/control sampling to review the results before resuming.

When an experiment is paused:
- The Flow will continue to run if it is published.
- All new users who qualify to see the Flow will see it.
- No new users will be placed into the exposed or control groups.
- Existing users in the control group will still be held back from seeing the Flow.
A paused experiment can always be resumed and set to RUNNING again by clicking Resume in the upper-right corner of the settings page of a paused experiment.

Ending a control experiment
Once you're done collecting experiment results and are ready to resume normal sampling of the Flow, you can click the End button on the upper-right corner of the experiment settings page to move the experiment to ENDED status. When an experiment is ended:

- The Flow will continue to run if it is published.
- All new users who qualify to see the Flow will see it.
- No new users will be placed into the exposed or control groups.
- Existing users in the control group will now be eligible to see the Flow.
Reporting on your control experiment
After an experiment begins running, you will be able to get reporting in Appcues on:
- The number of users placed into the exposed and control groups.
- The number of goal conversions and conversion rate for the exposed and control. groups (Note: goal conversion must have occurred within a 7-day window of being placed in one of the experiment groups).
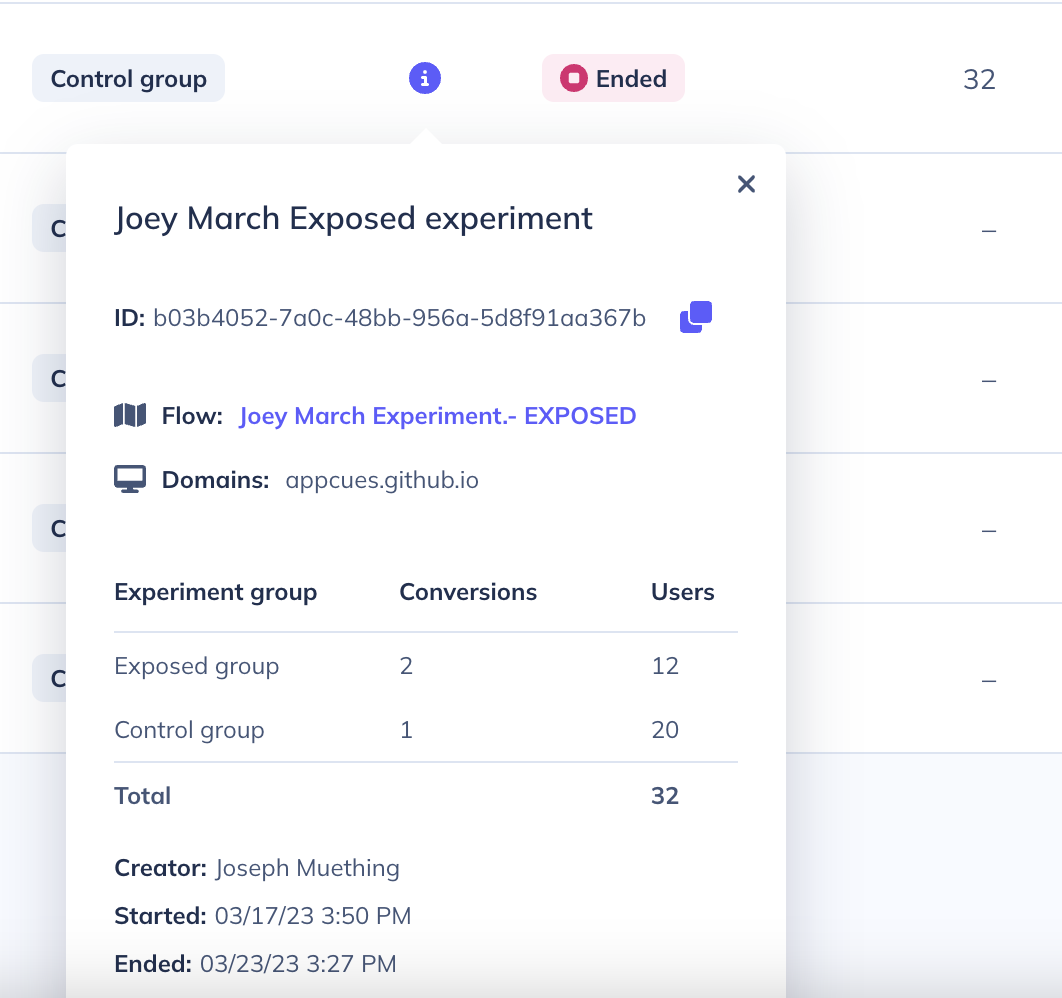
Once the experiment has reached its minimum sample size (across both the exposed and control groups), the following information will be shown on the experiments list page.
- The lift of the experiment (the % difference of the conversion rate between the exposed and control groups).
- The confidence in the experiment results, which is a measure of the statistical significance of the results, based on a 95% confidence level.
Until the minimum sample size is reached, the lift column will display a sample size progress bar and an estimate of how many days the experiment will need to run until the minimum sample size is reached.
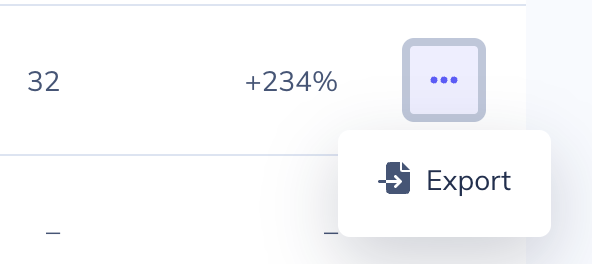
Raw experiment data (userID, experiment group, and conversion times for each user sampled during the experiment) can be exported from the list page.

Sending experiment data to your analytics integrations
Whenever a user is sampled for a control experiment, Appcues emits an “experiment_entered” event to all your front-end integrations. You can use these events to segment users in your analytics tools and further analyze experiment results between the exposed and control groups.