Test and debug your Appcues installation
Verify that Appcues is installed correctly, tracking pages, and identifying users — all from the built-in debugger. Use this guide whenever experiences aren't appearing or you suspect an installation issue.
Table of Contents
Open the Appcues debugger
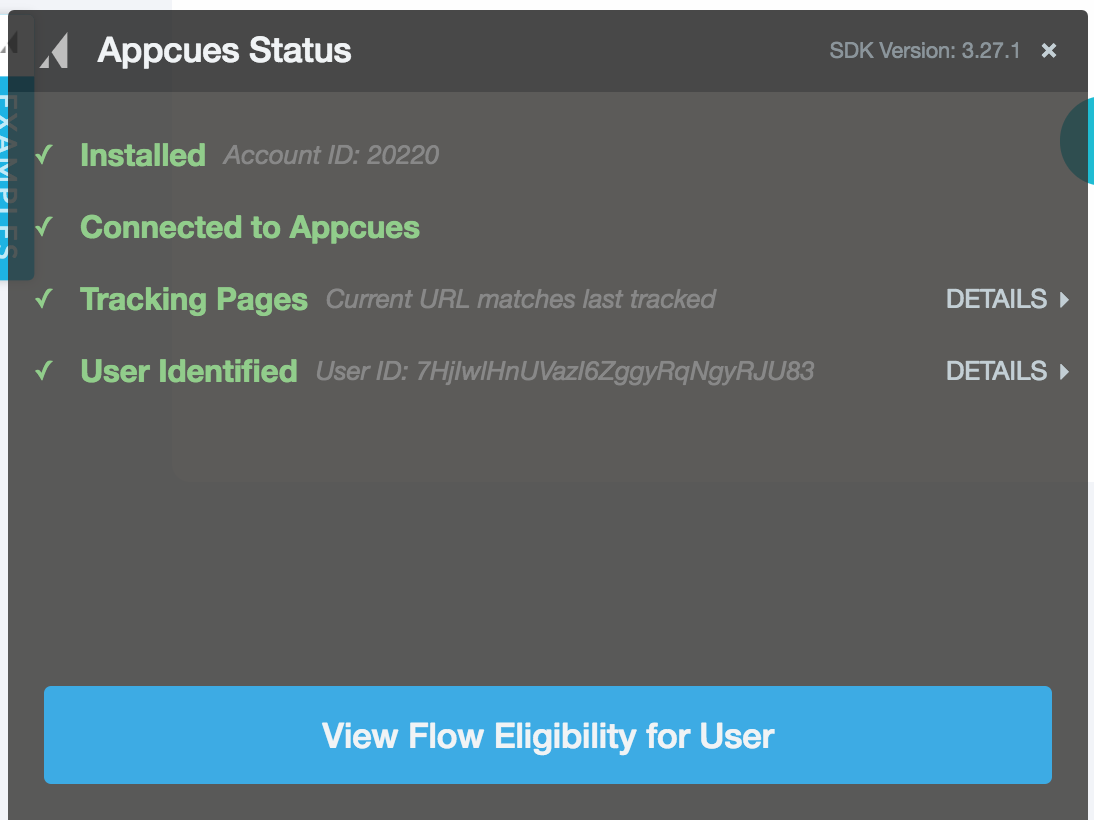
The debugger is a status panel that runs inside your application and shows whether Appcues is installed, tracking pages, and identifying users. There are two ways to open it.
Do not open the debugger while the Appcues Builder is open — it will return incorrect results. If the Builder opens by accident, close the browser tab, navigate back to the target page in a new tab, and try again.
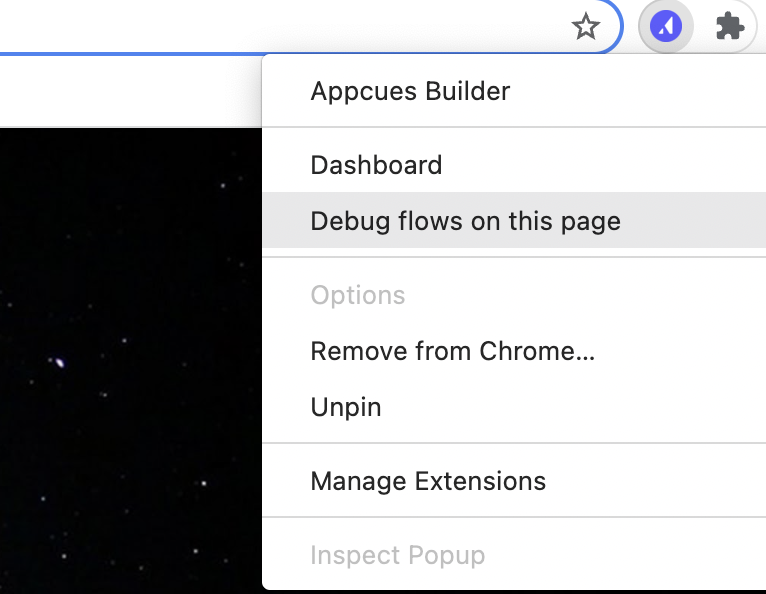
From the Chrome extension
- Navigate to the page where your experience should appear.
- Right-click the Appcues Chrome Extension icon in your browser toolbar and select Debug flows on this page…. The debugger panel appears at the bottom of the page.
From the browser console
- Right-click anywhere on the page and select Inspect, then select the Console tab.
-
Mac shortcut:
Cmd + Option + J -
Windows/Linux shortcut:
Ctrl + Shift + J
- Type
Appcues.debug()and press Enter. The debugger panel appears and stays visible for the rest of your session.
You may need to scroll to the bottom of the console to find the input field.
Check that Appcues is installed
Open the debugger using either method above. If the debugger panel loads, Appcues is installed on the current page.
If the panel does not load, Appcues is either not installed or something is blocking it:
- See Install the Appcues SDK to install correctly;
- See last items (Ad Blockers and CSP errors) to learn common blocking causes.
Confirm page tracking
- As you navigate through your app, the debugger watches for URL changes and shows whether Appcues has checked each one.
- Open the debugger, then navigate to a few pages in your app (or refresh the current page).
- Look at the Tracking Pages row in the debugger. It may briefly flash red while a new page loads — this is normal as long as it resolves to green.
- Green checkmark — Appcues is tracking page changes correctly.
- Red X that persists — Appcues is not detecting navigation. Expand the section to compare the Last Tracked URL against your browser's current URL. If they don't match, Appcues isn't picking up page changes.
Fix it
If your app is a single-page application (SPA), pages change without a full browser reload, so Appcues needs a way to detect those transitions. The recommended approach is to enable automatic URL detection by adding the following snippet directly above your Appcues script tag:
<script type="text/javascript">
  window.AppcuesSettings = {
    enableURLDetection: true
  };
</script>
If automatic detection isn't a fit, call Appcues.page() each time the URL changes in your app. Select your framework to see specific instructions.
Verify user data
- The debugger shows whether a user has been identified during the current session and how many properties were passed.
- Look at the User Identified row. Your User ID appears next to it.
- Click Details to expand the full list of user properties being sent for that user.
- Green checkmark — The user is identified and properties are being sent.
-
Red X — Appcues cannot recognize a user on this page. Add either the
Appcues.identify()call, theAppcues.anonymous()call, or both to your installation. See Identify Users and Groups.
If you installed Appcues via Segment: confirm that Segment's analytics.identify() call fires on this page so Appcues can recognize individual users. Learn more about Segment's identify call.
Common issues with user data
Properties missing from the debugger: Confirm that Appcues.identify() is called on every page load, not just on login. Appcues uses the most recent identify() call to evaluate targeting — if you only send properties once at login, any updates made during a session (like a plan upgrade) won't take effect until the next login.
Property names don't match targeting rules: Property names are case-sensitive. createdAt and createdat are treated as two separate properties. Compare what your code sends against what the debugger shows, and make sure targeting rules in Studio use the exact same name.
Duplicate properties: If your team uses inconsistent naming conventions, you can end up with duplicates like created_at and createdAt. Pick one convention (camelCase or snake_case) and stick with it across your entire installation.
Wrong property types: Each property should have a consistent type every time it's sent. Date properties must always be sent the same way — either as a Unix timestamp (number), an ISO date string, or MMM, DD, YYYY HH:MM:SS AM/PM format. Mixing formats causes unreliable targeting. Numbers sent as strings (like "10" instead of 10) will break comparison-based targeting since "10" is less than "2" when compared as strings.
Using email as User ID: If a user changes their email address, Appcues creates a new profile and their history splits in two. Use a stable database ID or UUID as the User ID instead.
null or empty values: If a property doesn't exist for a user, either don't send it or send it as null. Don't send an empty string — Appcues treats "" as a value, which can cause unexpected targeting matches.
Arrays or nested objects: Appcues.identify() only accepts strings, numbers, and booleans as property values. Any property sent as an array or nested object will not appear in your Appcues account.
To see all user properties across your account, go to Settings > Data > Properties > User in Appcues Studio.
Verify group data
- If you use
Appcues.group()to send account-level properties the debugger includes a Group Identified section below User Identified. - Look at the Group Identified row. Your Group ID appears next to it.
- Click Details to expand the full list of group properties being sent for the current user's account.
- Green checkmark — The group is identified and properties are being sent.
-
Red X — Appcues is not receiving group data on this page. Confirm that
Appcues.group()is being called afterAppcues.identify(). Ifgroup()fires before a user is identified, the data is not associated correctly.
Common issues with group data
Group properties not appearing in targeting: Property names are case-sensitive. Compare what your code sends against what the debugger shows — plan_level and Plan_Level are treated as two separate properties.
Group section missing entirely: The Group Identified row only appears if your installation includes an Appcues.group() call. If you're not using group properties, this section won't show. If you want to start sending group data, see Group Properties Overview.
Installed via Segment: Confirm that Segment's analytics.group() call is firing on this page. Appcues receives group data through Segment's group call, not through identify.
To see all group properties across your account, go to Settings > Data > Properties > Group in Appcues Studio.
Confirm event tracking
Events are the user actions your application sends to Appcues — things like "Invited Teammate," "Created Project," or "Exported Report." They're used for targeting, triggering, goals, and measuring impact. Without events, your installation is incomplete.
Verify events with the Events Explorer
The web debugger does not display a dedicated events panel. To confirm events are firing, use the Events Explorer in Appcues Studio.
- In your app, perform the action tied to an
Appcues.track()call (or a Click-to-Track event). - Open Events Explorer in Appcues Studio. Filter by Application Events (for code-based events) or Track Events (for Click-to-Track events).
- Search for the event name. If it appears with a recent Last Triggered timestamp, the event is being received. There could be a short delay.
- If the event does not appear, check the below.
Common issues with events
track() called before identify(): Appcues.track() must fire after Appcues.identify(). If track() runs before a user is identified, the event is dropped.
Event name mismatch: Event names are case-sensitive and matched by exact string. Invited Teammate and invited teammate are treated as two separate events. Compare the name in your code against what appears in Events Explorer.
Events sent server-side only: If you send events to Appcues exclusively through a server-side integration (like Segment's server-side libraries), those events are not available for event triggering — only for targeting and analytics. Event triggering requires client-side Appcues.track() or analytics.track() calls.
Click-to-Track event not firing: Confirm the event is enabled in the event list (disabled events are not tracked). Also verify the URL settings — an event set to "Only on this URL" won't fire on other pages even if the element exists there.
To learn more about setting up events, see Track events in your web app.
Cause: Ad blocker is interfering
Some ad blockers prevent the Appcues SDK from loading. If you see unexpected errors or the debugger won't open, try disabling your ad blocker on the page and refreshing.
For a permanent fix, host the Appcues SDK under your own domain. This requires developer help but prevents ad blockers from flagging the SDK as third-party.
Cause: Content Security Policy blocking Appcues
If your application enforces a Content Security Policy (CSP), it may block the Appcues SDK or Builder from loading — even when the installation is otherwise correct.
Identify CSP errors
- Open your browser's developer tools (right-click > Inspect > Console tab).
- Look for errors that mention "Content Security Policy" or "CSP" alongside an Appcues domain. These typically appear as
Refused to load the scriptorRefused to connectmessages. - If you see these errors, your CSP needs to allow Appcues domains.
Fix it
Your development team needs to add the required Appcues domains to the appropriate CSP directives (script-src, connect-src, style-src, img-src, frame-src). The exact domains depend on which Appcues features you use.
See Content Security Policies for the full list of domains to allow.
Confirm: After updating the CSP, hard-refresh the page (Ctrl + Shift + R / Cmd + Shift + R) and reopen the debugger. All rows should show green checkmarks, and the Builder should load without console errors.
Reposition the debugger
If the debugger panel overlaps important parts of your UI, reposition it by running this snippet in your browser console:
(function() {
  const { style } = document.querySelector('appcues-debugger');
  style.left = '40%';
  style.bottom = '25%';
})();
Adjust the left and bottom values as needed.
Good call — here's a tighter version that keeps the practical value without overexplaining:
Inspect network activity
For deeper troubleshooting, you can use your browser's Network tab to see exactly what the Appcues SDK is doing.
- Open DevTools (
F12orCmd+Option+I) and select the Network tab. - Reload the page to capture traffic from the start.
- Type
appcuesin the filter bar to isolate Appcues requests.
The SDK communicates with two domains: fast.appcues.com delivers the SDK bundle and experience content, and api.appcues.net handles API calls and a WebSocket connection used for real-time data exchange.
Check the WebSocket connection
Click the Socket filter in the Network tab to show only WebSocket connections. Look for a connection to api.appcues.net, then click it and select the Messages tab to see data flowing between the browser and Appcues. This confirms whether identify and page calls are being sent and whether experience data is coming back. Outgoing messages (sent from the browser) appear with a green arrow; incoming messages (from the server) appear with a white or red arrow, depending on your browser.
If requests are blocked or failing, an ad blocker, browser extension, or Content Security Policy is likely interfering. See Host the Appcues SDK under your own domain or Content Security Policies for solutions. If no WebSocket connection appears at all, the SDK may not have initialized — start with the debugger checks above.
Tip: Right-click any message in the Messages tab and select Copy message to grab the payload and share it with Appcues support.
Still stuck?
Collect the following and email support@appcues.com:
- The experience name and its URL from Studio (copy from your browser's address bar on the settings page).
- A demo login for your site so support can access the targeted page.
- A screenshot or screen recording showing the debugger output.
- Any console errors visible in your browser's developer tools.
- Steps you've already tried from this guide.