Run a control experiment
Prove your Flow's impact by measuring conversion lift against a holdout group that never sees it.
Table of Contents
A control experiment measures whether a Flow actually drives user behavior by comparing two groups: an exposed group that sees the Flow and a control group that doesn't. The difference in Goal conversion between the groups tells you the Flow's incremental impact.
Prerequisites
- A published Flow set to Show once
- A Goal attached to the Flow
- The Flow must not be shown in a Launchpad
- Any Frequency Limit on the Flow should be overridden
How it works
When an experiment is running, Appcues randomly assigns each newly eligible user to one of two groups based on the Traffic Allocation slider (default 50/50):
- Exposed group — sees the Flow normally.
- Control group — is intentionally blocked from seeing the Flow for the duration of the experiment.
Each user gets a random number from 1–100. If that number is less than or equal to the control group percentage, they go into the control group. Because the split is random, group sizes won't be perfectly equal.
If a user qualifies for multiple Flows at once, the highest-priority Flow shows regardless of the experiment. This can affect when a user gets assigned to a group.
Create an experiment
- Go to Metrics > Experiments (or Experiences > Flows > Experiment).
- Click New experiment.
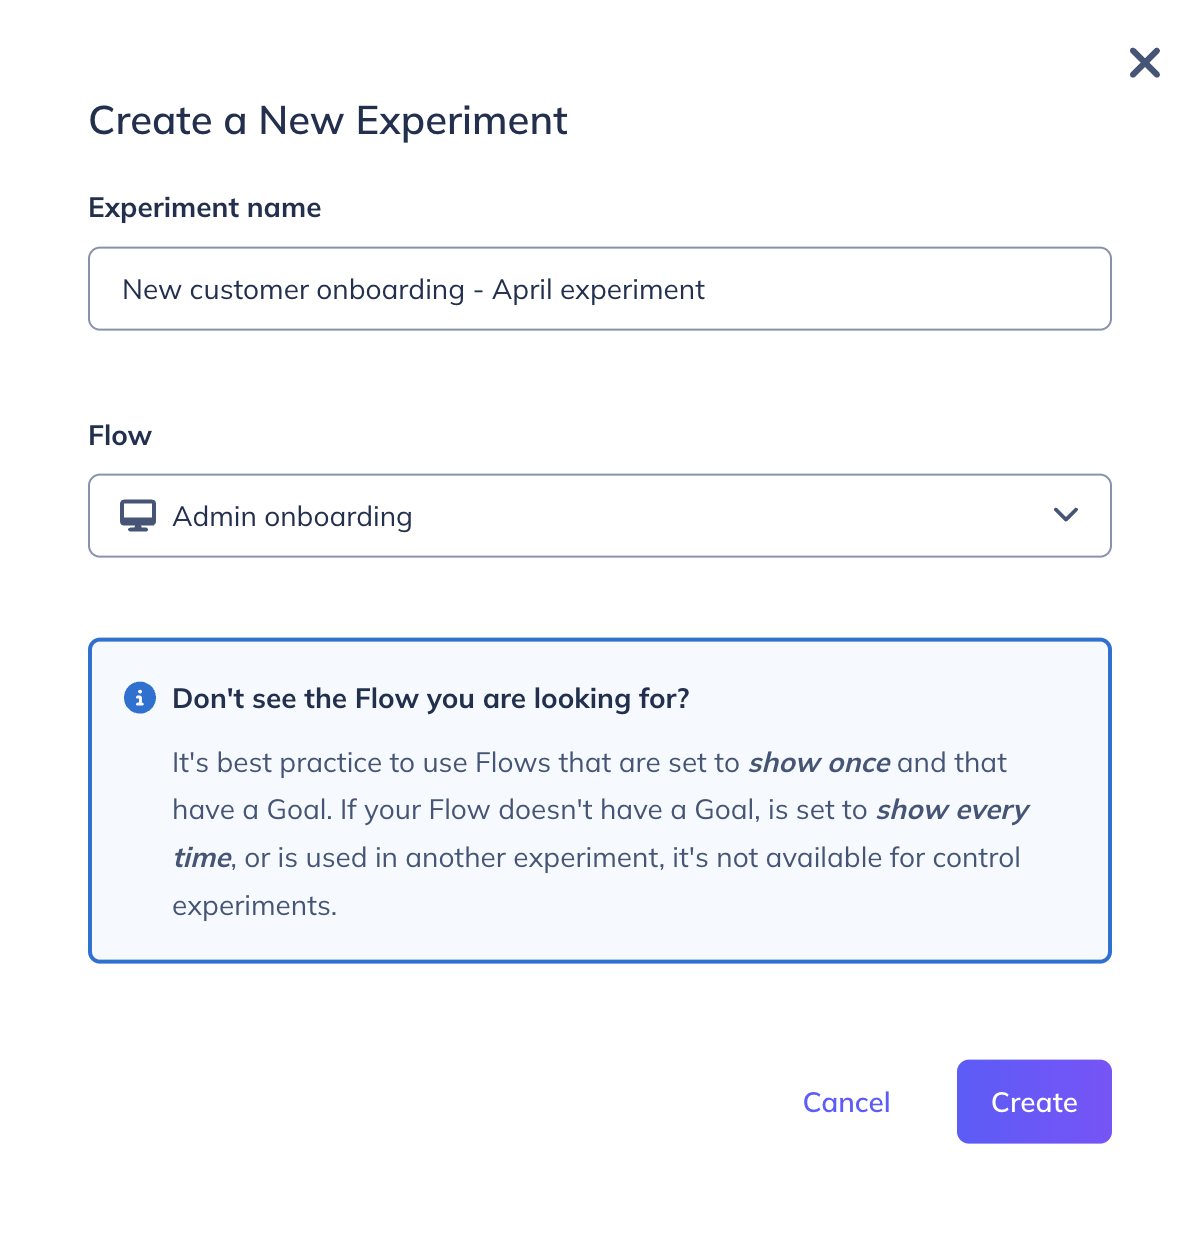
- Enter an experiment name and select the Flow to test. Flows with an existing Draft, Running, or Paused experiment won't appear — end the previous experiment first.
- Click Create.
Configure and launch
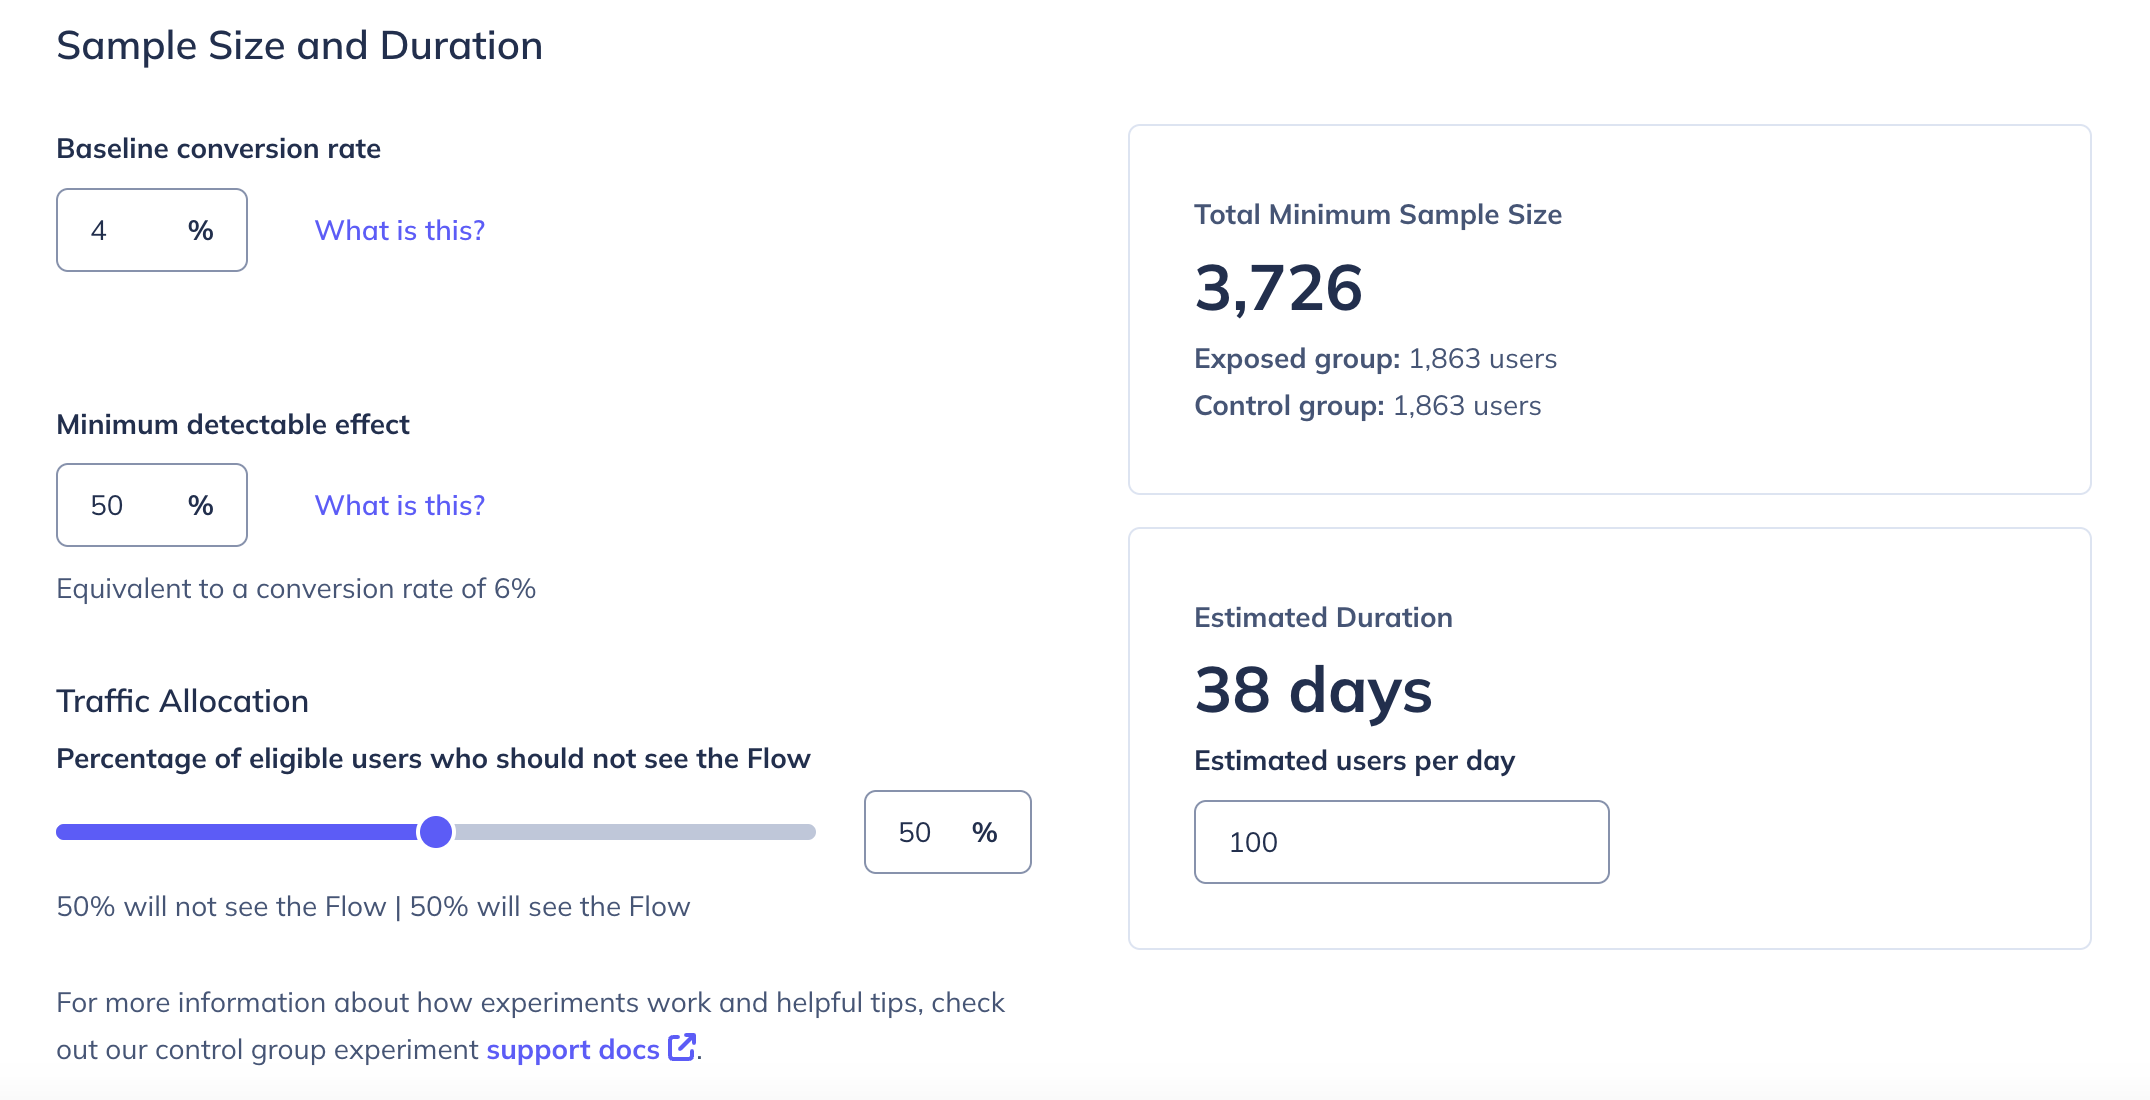
- On the experiment settings page, enter your estimates for baseline conversion rate and minimum detectable effect. Appcues uses these to calculate a Minimum Sample Size and Estimated Duration.
- Adjust the Traffic Allocation slider if you want something other than a 50/50 split.
- Click Start. The experiment status changes to Running.
- Make sure the Flow is also published — starting the experiment and publishing the Flow are separate actions.
Don't stop the experiment the first time results cross the significance threshold. Early results fluctuate. Wait until you've reached the minimum sample size before drawing conclusions. Check out this post for more information about our approach.
Pause and resume
Click Pause in the upper-right corner of the settings page. While paused:
- The Flow continues running for all new qualifying users (no one is held back).
- No new users are added to either group.
- Existing control group users are still blocked from seeing the Flow.
Click Resume to restart sampling.
End an experiment
Click End when you're done collecting data. Once ended:
- The Flow continues running normally.
- No new users are added to either group.
- Control group users become eligible to see the Flow again.
- The experiment cannot be resumed.
Read the results
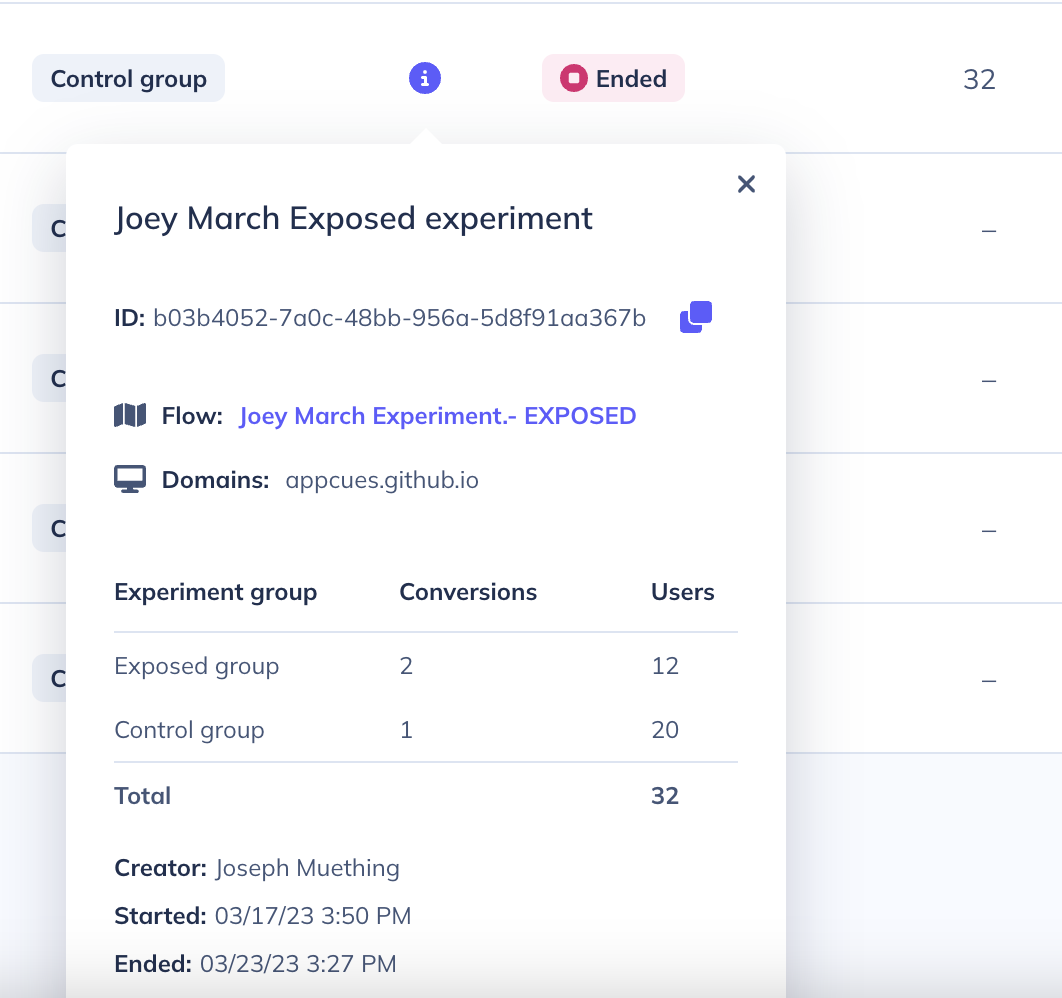
The experiment report shows:
- Users in each group
- Goal conversions and conversion rate per group (conversions must occur within 7 days of group assignment). The difference in goal conversion between the exposed and control groups will be used to determine if your Flow is having a positive or negative impact in driving users to take a specific action.
Goal conversions are only counted for users who achieved the Goal after entering the experiment. If a user achieves the Goal after the experiment starts but before they qualify and enter it, that conversion is not included in experiment analytics — even though the user was assigned to a group and (if exposed) saw the Flow. Flow analytics are unaffected by this and will still reflect all users who saw the Flow.
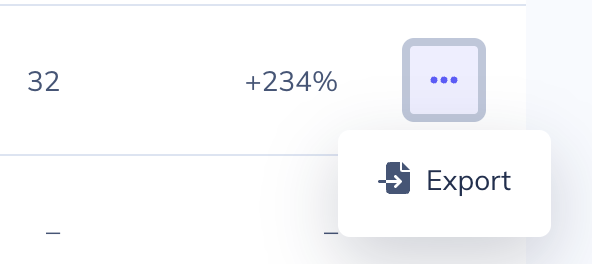
- Lift — the percentage difference in conversion between exposed and control groups (appears after minimum sample size is reached)
- Confidence — statistical significance at a 95% confidence level (appears after minimum sample size is reached)
Before the minimum sample size is reached, a progress bar shows how close you are and an estimated number of days remaining.
Export raw data (User ID, group assignment, and conversion times) from the experiments list page. The export may not include all users who entered the experiment — users whose Goal conversion occurred before they entered the experiment are excluded from this data.
Get the full list of experiment participants
The experiment export and in-app analytics only include users whose Goal conversion happened after they entered the experiment. To get a complete list of all users who entered the experiment — including their group assignment and Goal conversion time — contact support.
There is currently no self-service way to export the full control group user list. As a workaround, you can create a Segment to identify control group users.
Send experiment data to integrations
Appcues emits an experiment_entered event to all front-end integrations whenever a user is sampled. Use this event to segment users in your analytics tools for deeper analysis.